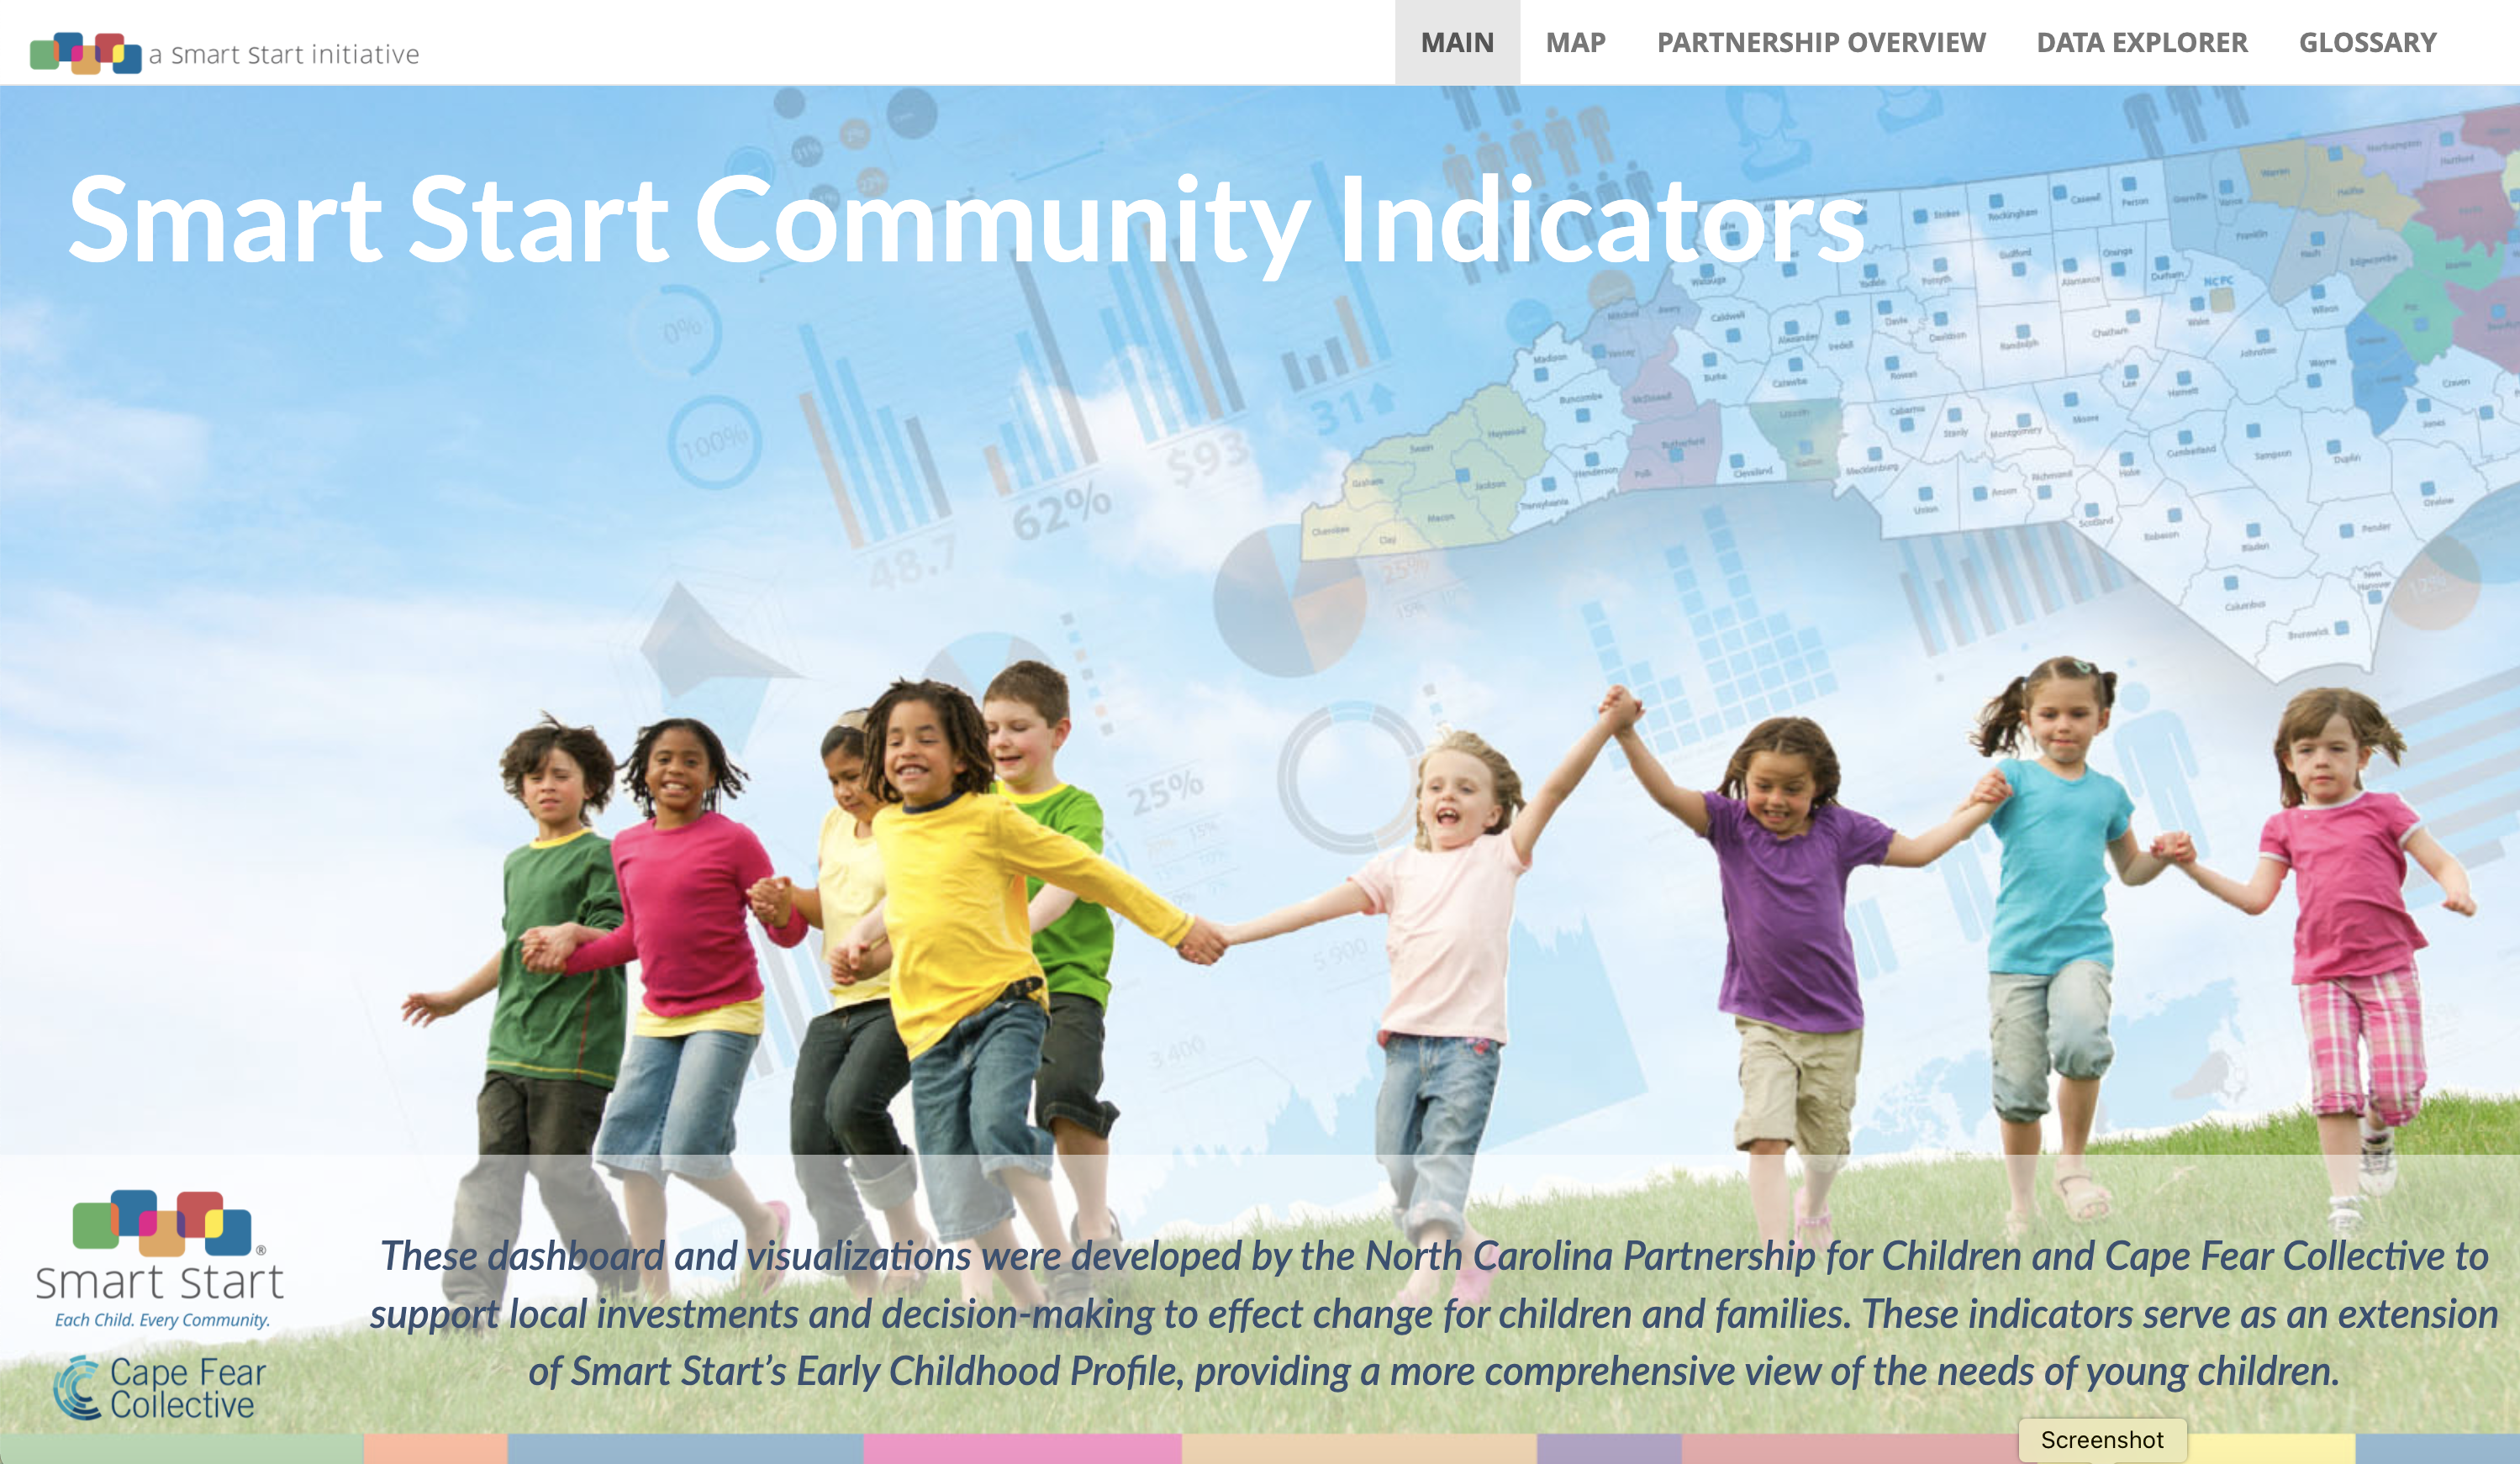
The Smart Start Community Indicators Dashboard

data dashboard image children running down a hill graphs and charts faded into background

NCPC is committed to advancing a high-quality, comprehensive, accountable early childhood system. To create this system, it is critical that high-quality data is collected for the state and that Smart Start Local Partnerships are using this data to support their decision-making.

To ensure insights are based on up-to-date metrics, Smart Start launched Smart Start Community Indicators, a data dashboard. The dashboard contains insights and visualizations to support planning and decision making for county-level investments. It provides data on critical early childhood indicators at the county, local partnership, and census-tract level. Indicators include population level, child abuse incidence, infant mortality, and teen birth incidence. By utilizing this data, local partnerships can better plan and make decisions for their community as well as examine inequities that may exist with their community and specific metrics.
By using the Smart Start Community Indicators Dashboard, we can better identify and understand communities — confirming what we already know as well as highlighting trends and inequities that exist.

Feedback

We would love to hear your feedback on the Community Indicators Dashboard. You may also send any questions about operating the dashboard to Casey Strange, Director of Learning & Evaluation. We will be updating the dashboard based on your feedback so please provide feedback based on your data needs and the ease of using and understanding the dashboard.

Overview and Instructional Videos

Overview video outlining how to use the Smart Start Community Indicators Dashboard.
Instructional video examining how Smart Start local partnerships can utilize the dashboard data to make smart decisions with equity and data at the forefront of their decision making.
Share This:
Translate »